What if London's buildings grew according to the amount of data they generate? The video below is the first step in an approach to visualising an urban landscape using the objects that already exist in it; instead of abstract swirling points, bars, and artefacts hovering in the sky, the buildings themselves become the medium by which the data generated in and around them are made visible.
Mapping London's Buildings using Twitter from Steph on Vimeo.
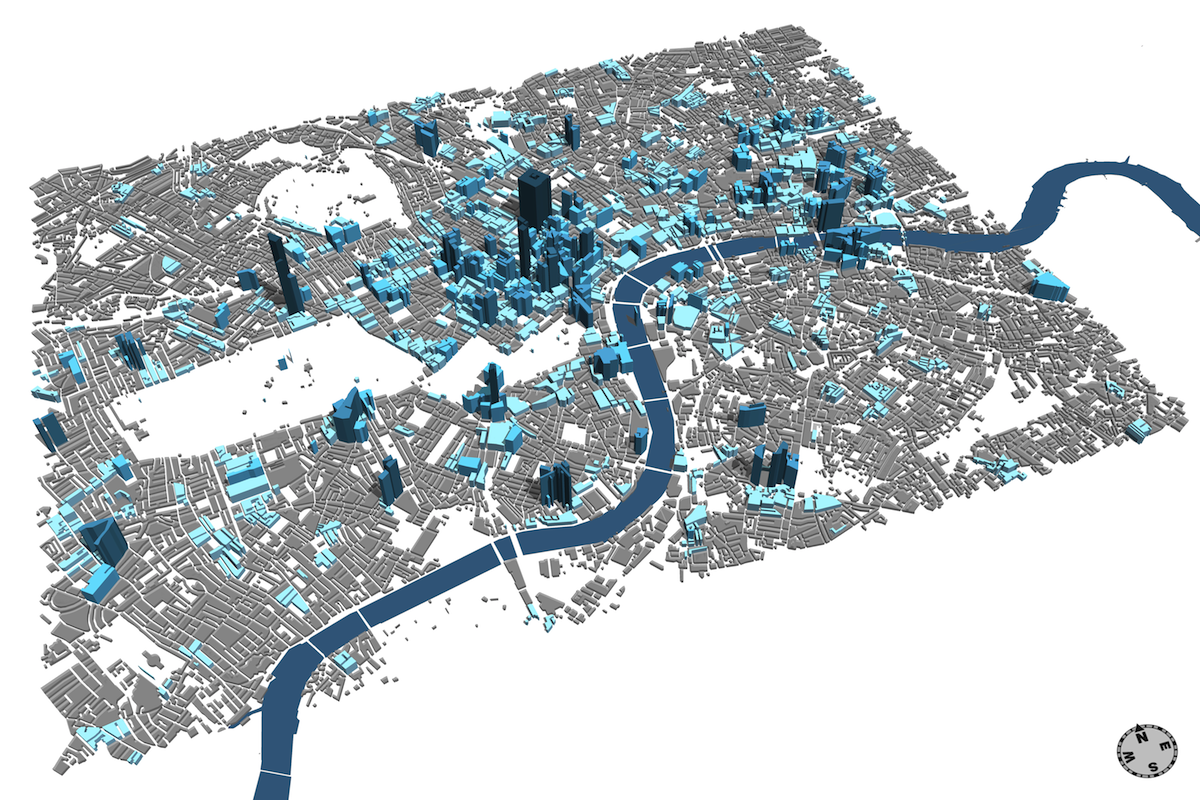
The taller a building is, the more geotagged tweets have been sent from within and immediately adjacent to it. Buildings grow upwards in real time, and gradually darken as more data accumulate.
We are not limited to using tweets to generate these landscapes; any source of real-time data can be used to affect the shape, height, and colour of the objects you see.
We gathered geotagged tweets for 15 hours and 40 minutes for this first video, beginning at 21:45 on Monday the 1st of July, 2013. We gathered a total of 3568 data points, which were visualised using Esri's CityEngine.
Flora has blogged about the project here, and you can view the technical details on Github
This work may be cited using the following DOI: 10.5281/zenodo.9795
Project created by Stephan Hügel (@urschrei) and Flora Roumpani (@en_topia) at UCL CASA.